Sea Level Rise on Coastal Cities
Interactive Story
July, 2020
HTML, CSS, JS, P5.js

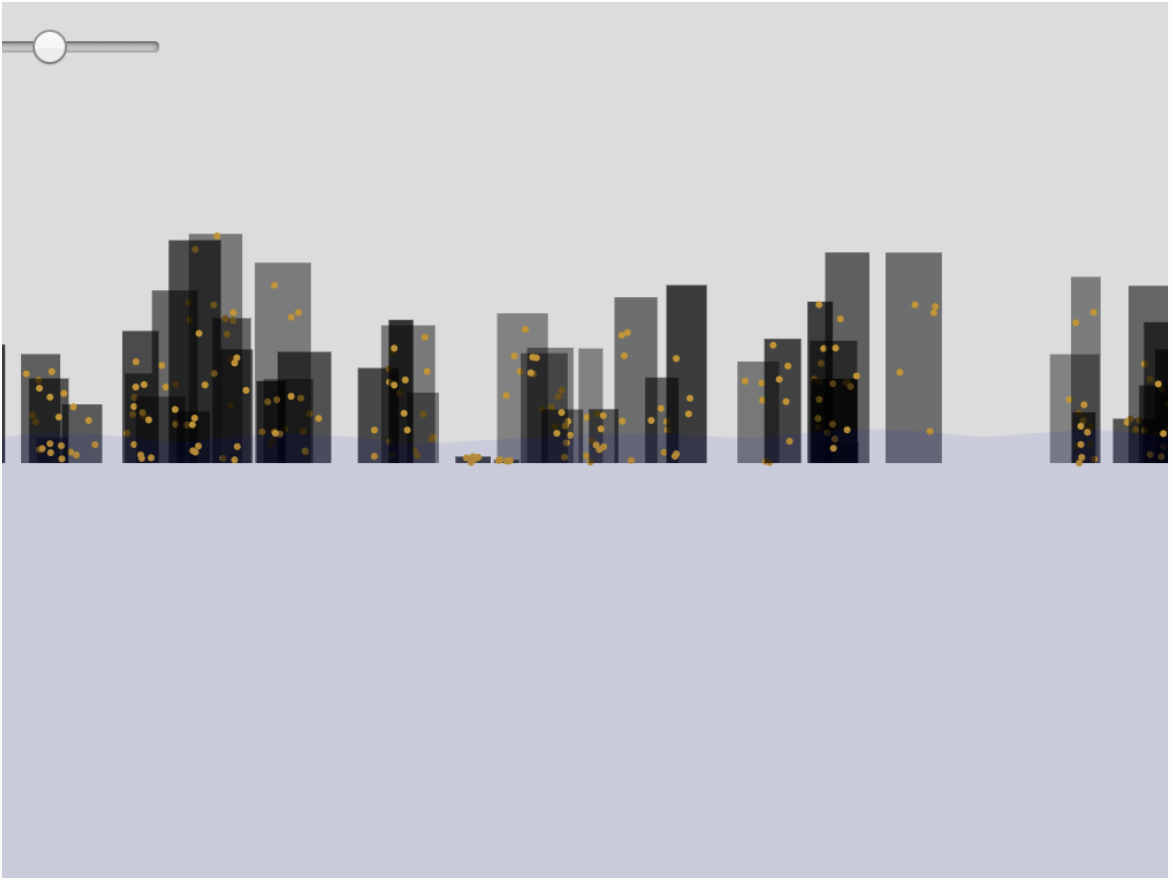
This visualization allows you to enter in the amount of CO2 pollution in a city and see how much the sea will rise.
Interactive Story
July, 2020
HTML, CSS, JS, P5.js

This visualization allows you to enter in the amount of CO2 pollution in a city and see how much the sea will rise.