U.S. Public School Funding
Interactive Data Viz
June, 2020
HTML, CSS, JS, D3.js

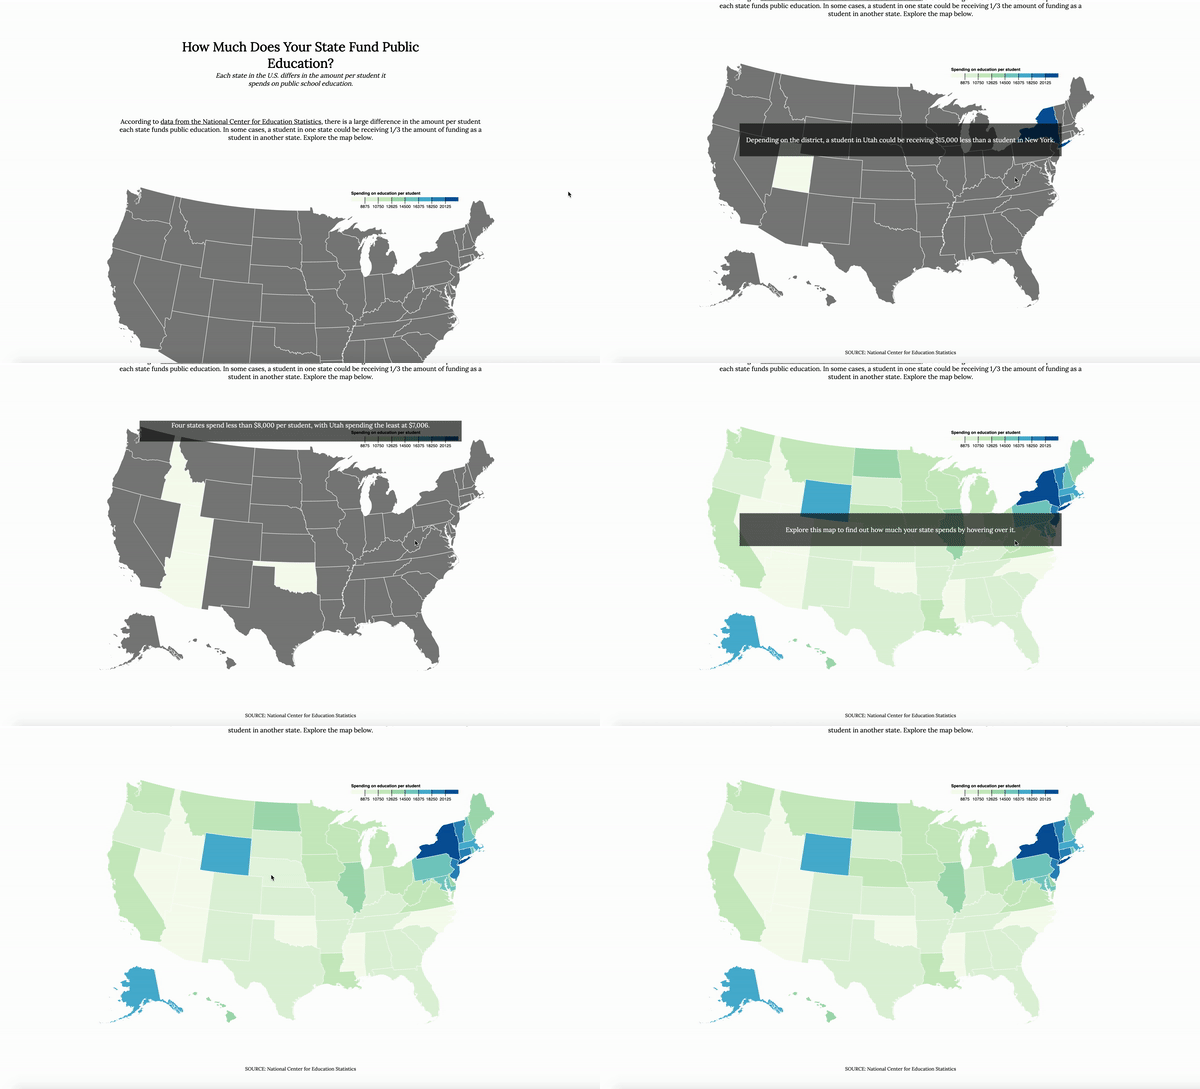
There is a large discrepency between public school funding by state. This interactive map showcases these differences.
A user can scroll through this story while the relevant pieces of the map highlight when mentioned. Once finished scrolling, the user can hover over any state to see how much state funding it receives for its public schools.

Read and interact with this story here.